| name of test |
description |
hypotheses |
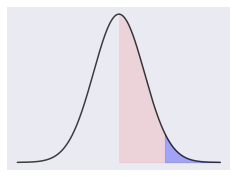
z-test
parametric
example
|
to determine whether two means are different
(to determine whether two samples come from the same population)
- population must be normal distribution
- sample number is large enough
- population SD σ are required
|
H0 : μ0 = μ1
H1 : μ0 ≠ μ1 |
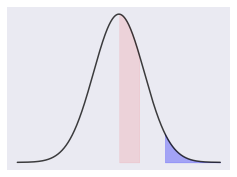
Welch's t-test
parametric
example
|
to determine whether two means are different
- df (degree of freedom) = sample number - 1
- use sample SD s instead of population SD
- for Welch's t-test, the assumption of equal variances are NOT required
- increasing sample size results in decreasing p-value
- effect size (Cohen d) is useful to know how much they differ
|
H0 : μ0 = μ1
H1 : μ0 ≠ μ1 |
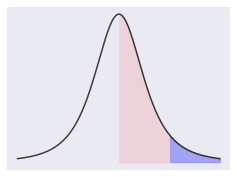
Mann-Whitney U-test
nonparametric
example
|
to determine whether two medians are different
- can deal with ordinal scale
- the assumption of normal distribution are NOT required
- is often used instead of t-test
|
H0 : medians of the two data are identical P(xi≧yj)=1/2
H1 : medians of the two data are NOT identical P(xi≧yj)≠1/2 |
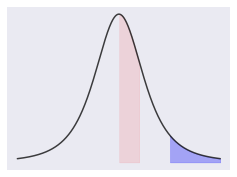
paired t-test
parametric
example
|
to determine whether two paired data are different
- only "differences" of the two data are required
|
H0 : μ = 0
H1 : μ ≠ 0 |
Wilcoxon signed-rank test
nonparametric
example
|
to determine whether two paired data are different
- can deal with ordinal scale
- the assumption of normal distribution are NOT required
- is often used instead of paired t-test
|
H0 : μ = 0
H1 : μ ≠ 0 |
F-test
parametric
example
|
to determine whether two variances are different
- df (degree of freedom) = sample number - 1
- for Welch's t-test, the assumption of equal variances are NOT required
|
H0 : s02 = s12
H1 : s02 ≠ s12 |
Pearson's correlation
parametric
|
to measure how much two data correlates
- X and Y must have the same length
- X and Y must be interval/ratio scale
- linear correlation is assumed
- If the true correlation is not linear, it may not help
|
- |
Spearman's rank correlation
nonparametric
|
to measure how much two data correlates
- X and Y must have the same length
- X and Y must can be ordinal scale
|
- |
Shapiro-Wilk test
(test of normality)
parametric
|
to determine whether samples are normally distributed
- if normally distributed, Q-Q plot will be linear
|
H0 : normally distributed
H1 : NOT normally distributed |
χ2 test
(goodness of fit)
nonparametric
example
|
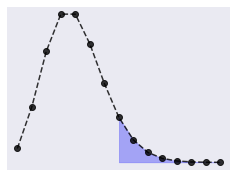
to determine whether distribution of samples follows an ideal distribution
- data must have two sets of distributions
- one is distribution of observed numbers, the other is ideal (expected) distribution
- distribution can have any number of groups/categories
| H0 : observed distribution is identical to ideal distribution
H1 : observed distribution is NOT identical to ideal distribution |
χ2 test
(independence)
nonparametric
example
|
to determine whether two parameters are independent
- data must have exactly two parameters (dimensions)
- each dimension can have any number of groups/categories (m×n table)
- each value of the table should be more than 5
- If it is less than 5, you should apply Yates's correction
- does not say which categories are different more
- If you want to know it, Residual Analysis is required
| H0 : two parameters are independent (no correlation)
H1 : two parameters are dependent |
1-way ANOVA
(Analysis of Variance)
parametric
example
|
to determine whether all means are different
- must have three or more groups
- ANOVA does not say which groups are different more
- If you want to know it, Multiple Comparisons are required
|
H0 : all μi are equal
H1 : NOT all μi are equal |
2-way ANOVA
without replication
parametric
example
|
to determine whether all means are different
- must have two different dimensions
- each dimension has two or more groups (total n×m groups)
- the data of each group is only one value
- no interaction between rows and columns
- does not say which groups are different more
- If you want to know it, Multiple Comparisons are required
|
H0 : all μi are equal
H1 : NOT all μi are equal |
2-way ANOVA
with replication
parametric
example
|
to determine whether all means are different
- must have two different dimensions
- each dimension has two or more groups (total n×m groups)
- the data of each group can replicate (can have multiple values)
- can calculate the interaction between rows and columns
- does not say which groups are different
- If you want to know it, Multiple Comparisons are required
|
H0 : all μi are equal
H1 : NOT all μi are equal |